47. MT3DMS Problem 10, Two Domains
This example is based on problem 10 from the MT3DMS manual (Zheng & Wang, 1999). The goal in this example is not to compare the final results to the MT3DMS data presented there, but to show how to create an equivalent setup of that problem using a multi-model approach with the GWF-GWF and GWT-GWT Model Exchanges. To validate its outcome, we can compare the simulated concentration in the study area to the MODFLOW 6 results from the original example.
47.1. Example description
The simulated processes and configuration data for this example are
identical to those in MODFLOW 6 MT3DMS problem 10 elsewhere in these
examples. However, for this example the study site has been modeled as a
separate GWF model and a coupled GWT model, embedded in in a coarser,
surrounding system. fig-ex-gwtgwt-grid shows the
decomposition of the original grid for the current multi-model approach.
By design, this alternative model setup should yield equivalent results.
47.2. Example Results
(Explain how the figures prove that the results are identical within the solver’s tolerance)
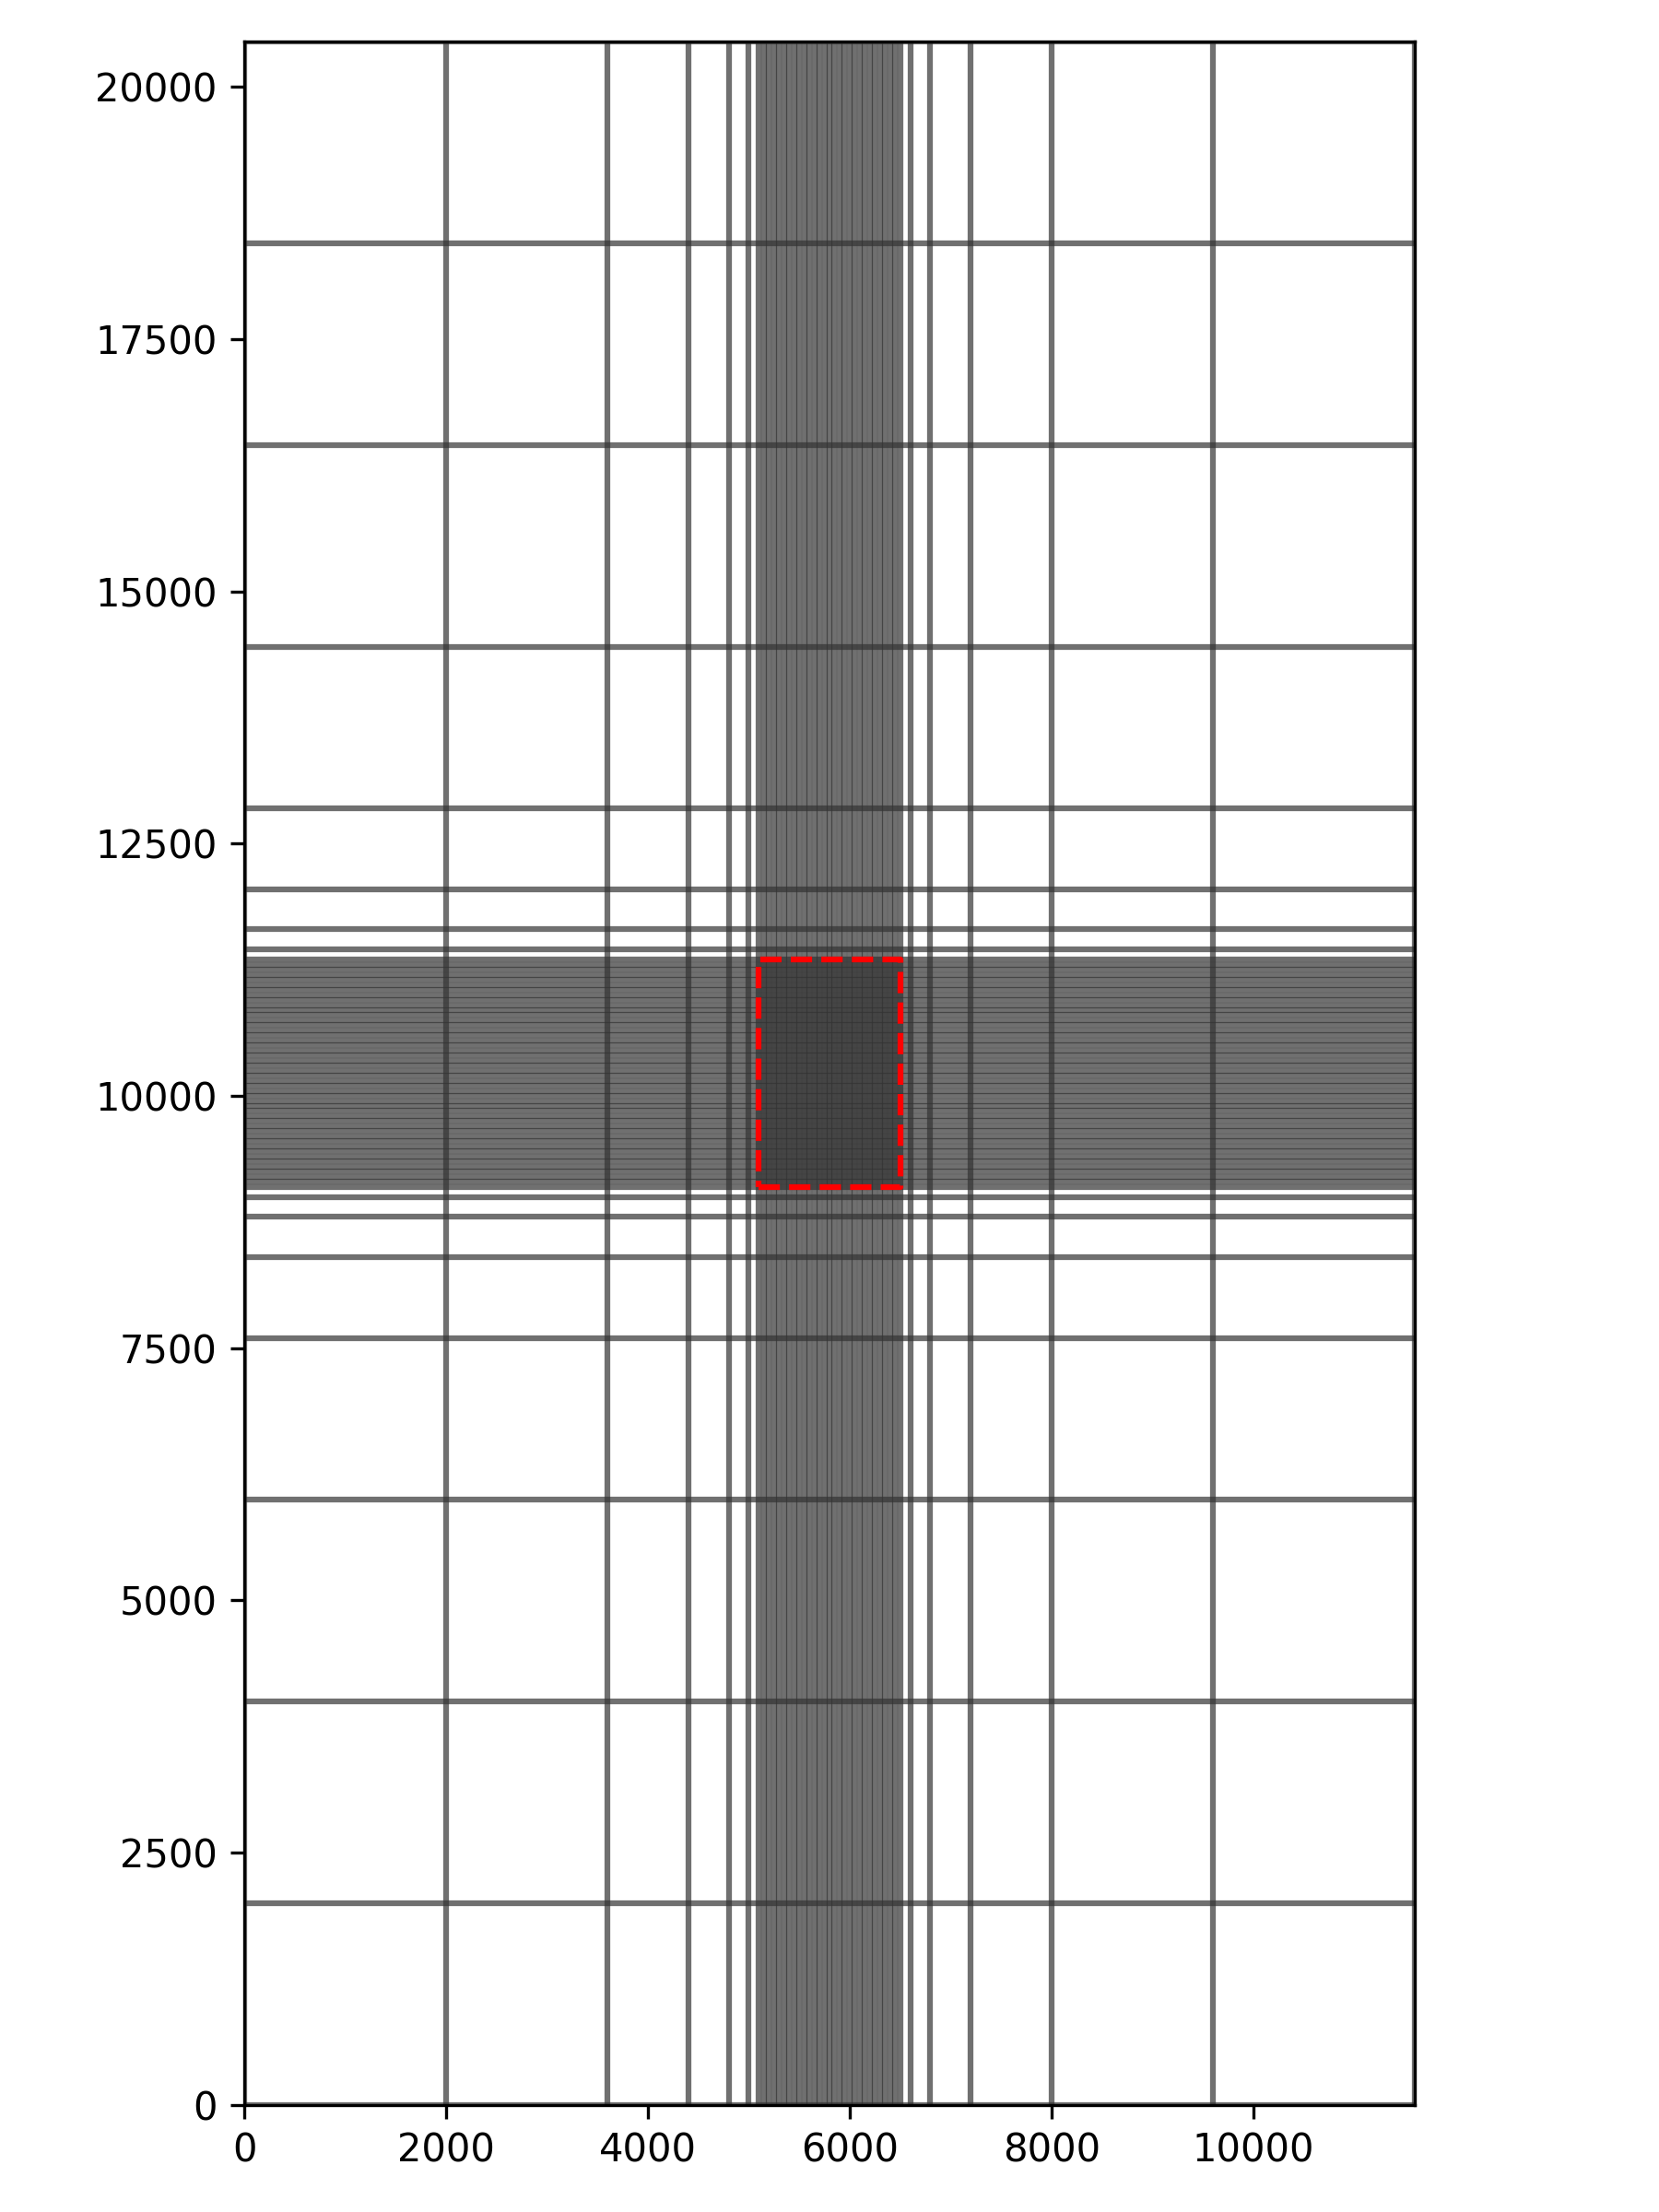
Figure 47.1 The model grid for the studied problem. The red dashed rectangle shows where the GWF and GWT Model Exchange connects the inner to the outer models.
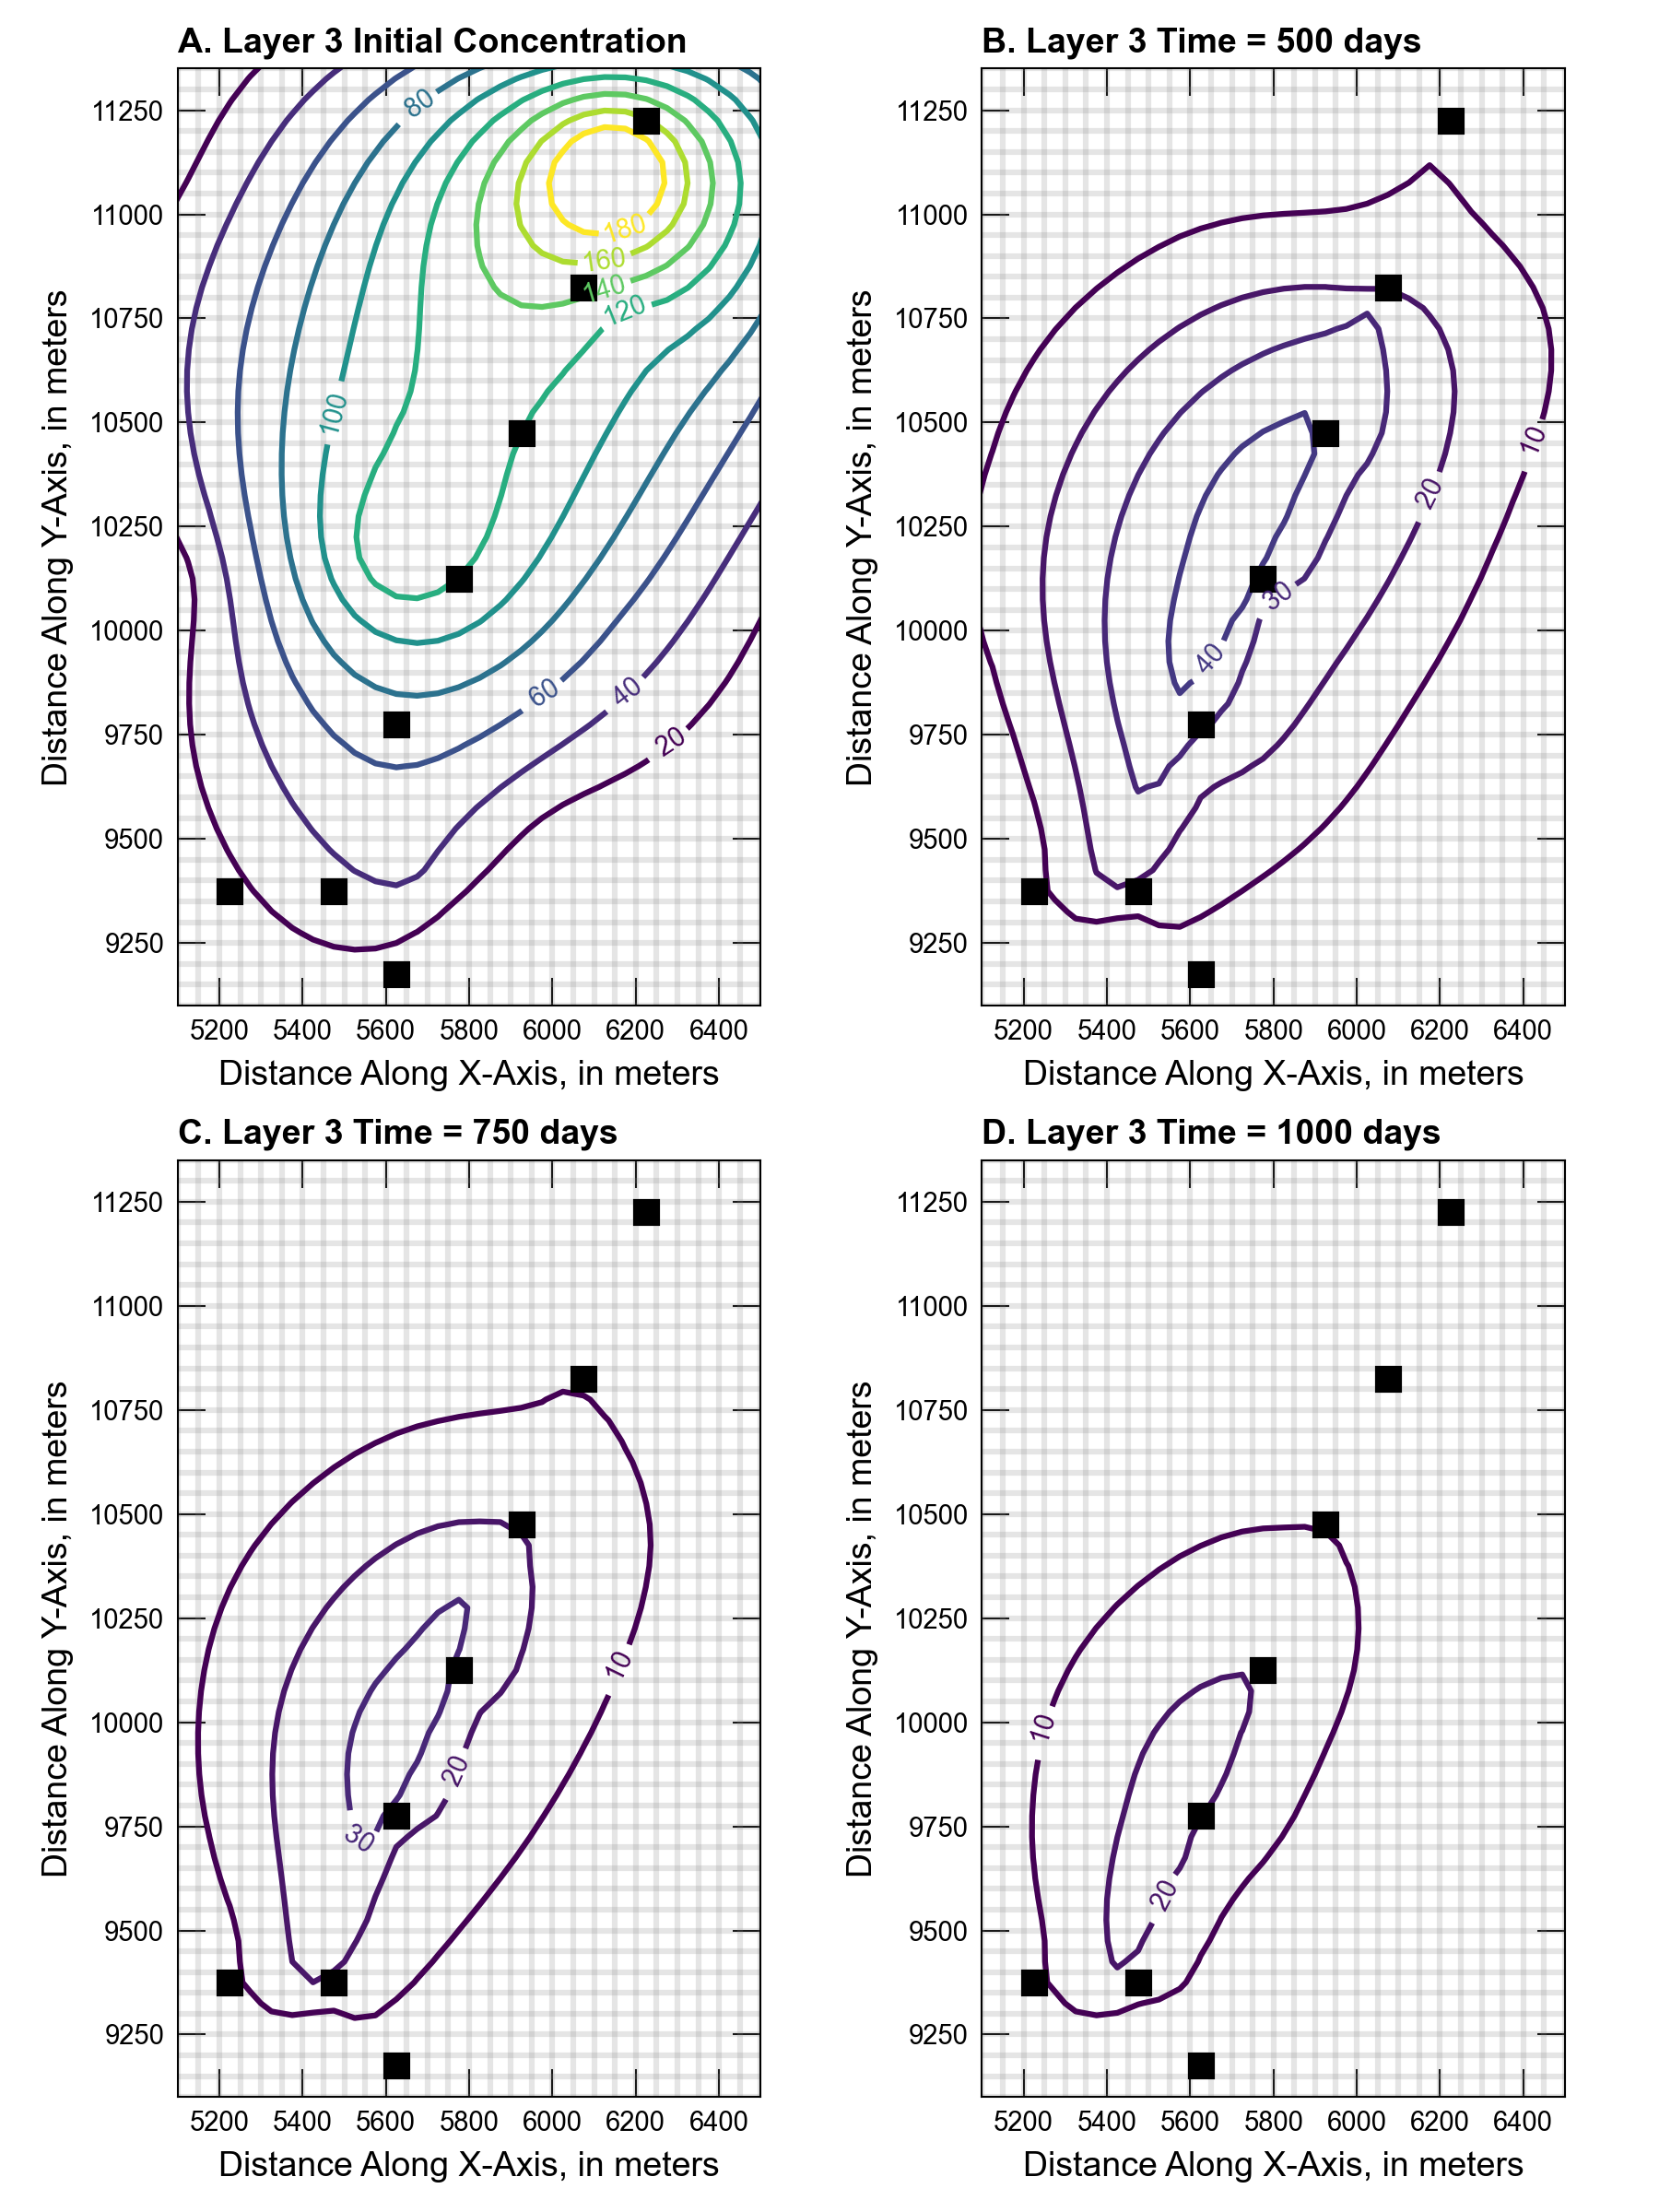
Figure 47.2 (A) Initial and simulated contaminant plume concentrations in model layer 3 as calculated by MODFLOW 6 with the multi-model setup after (B) 500 days, (C) 750 days, and (D) 1,000 days.
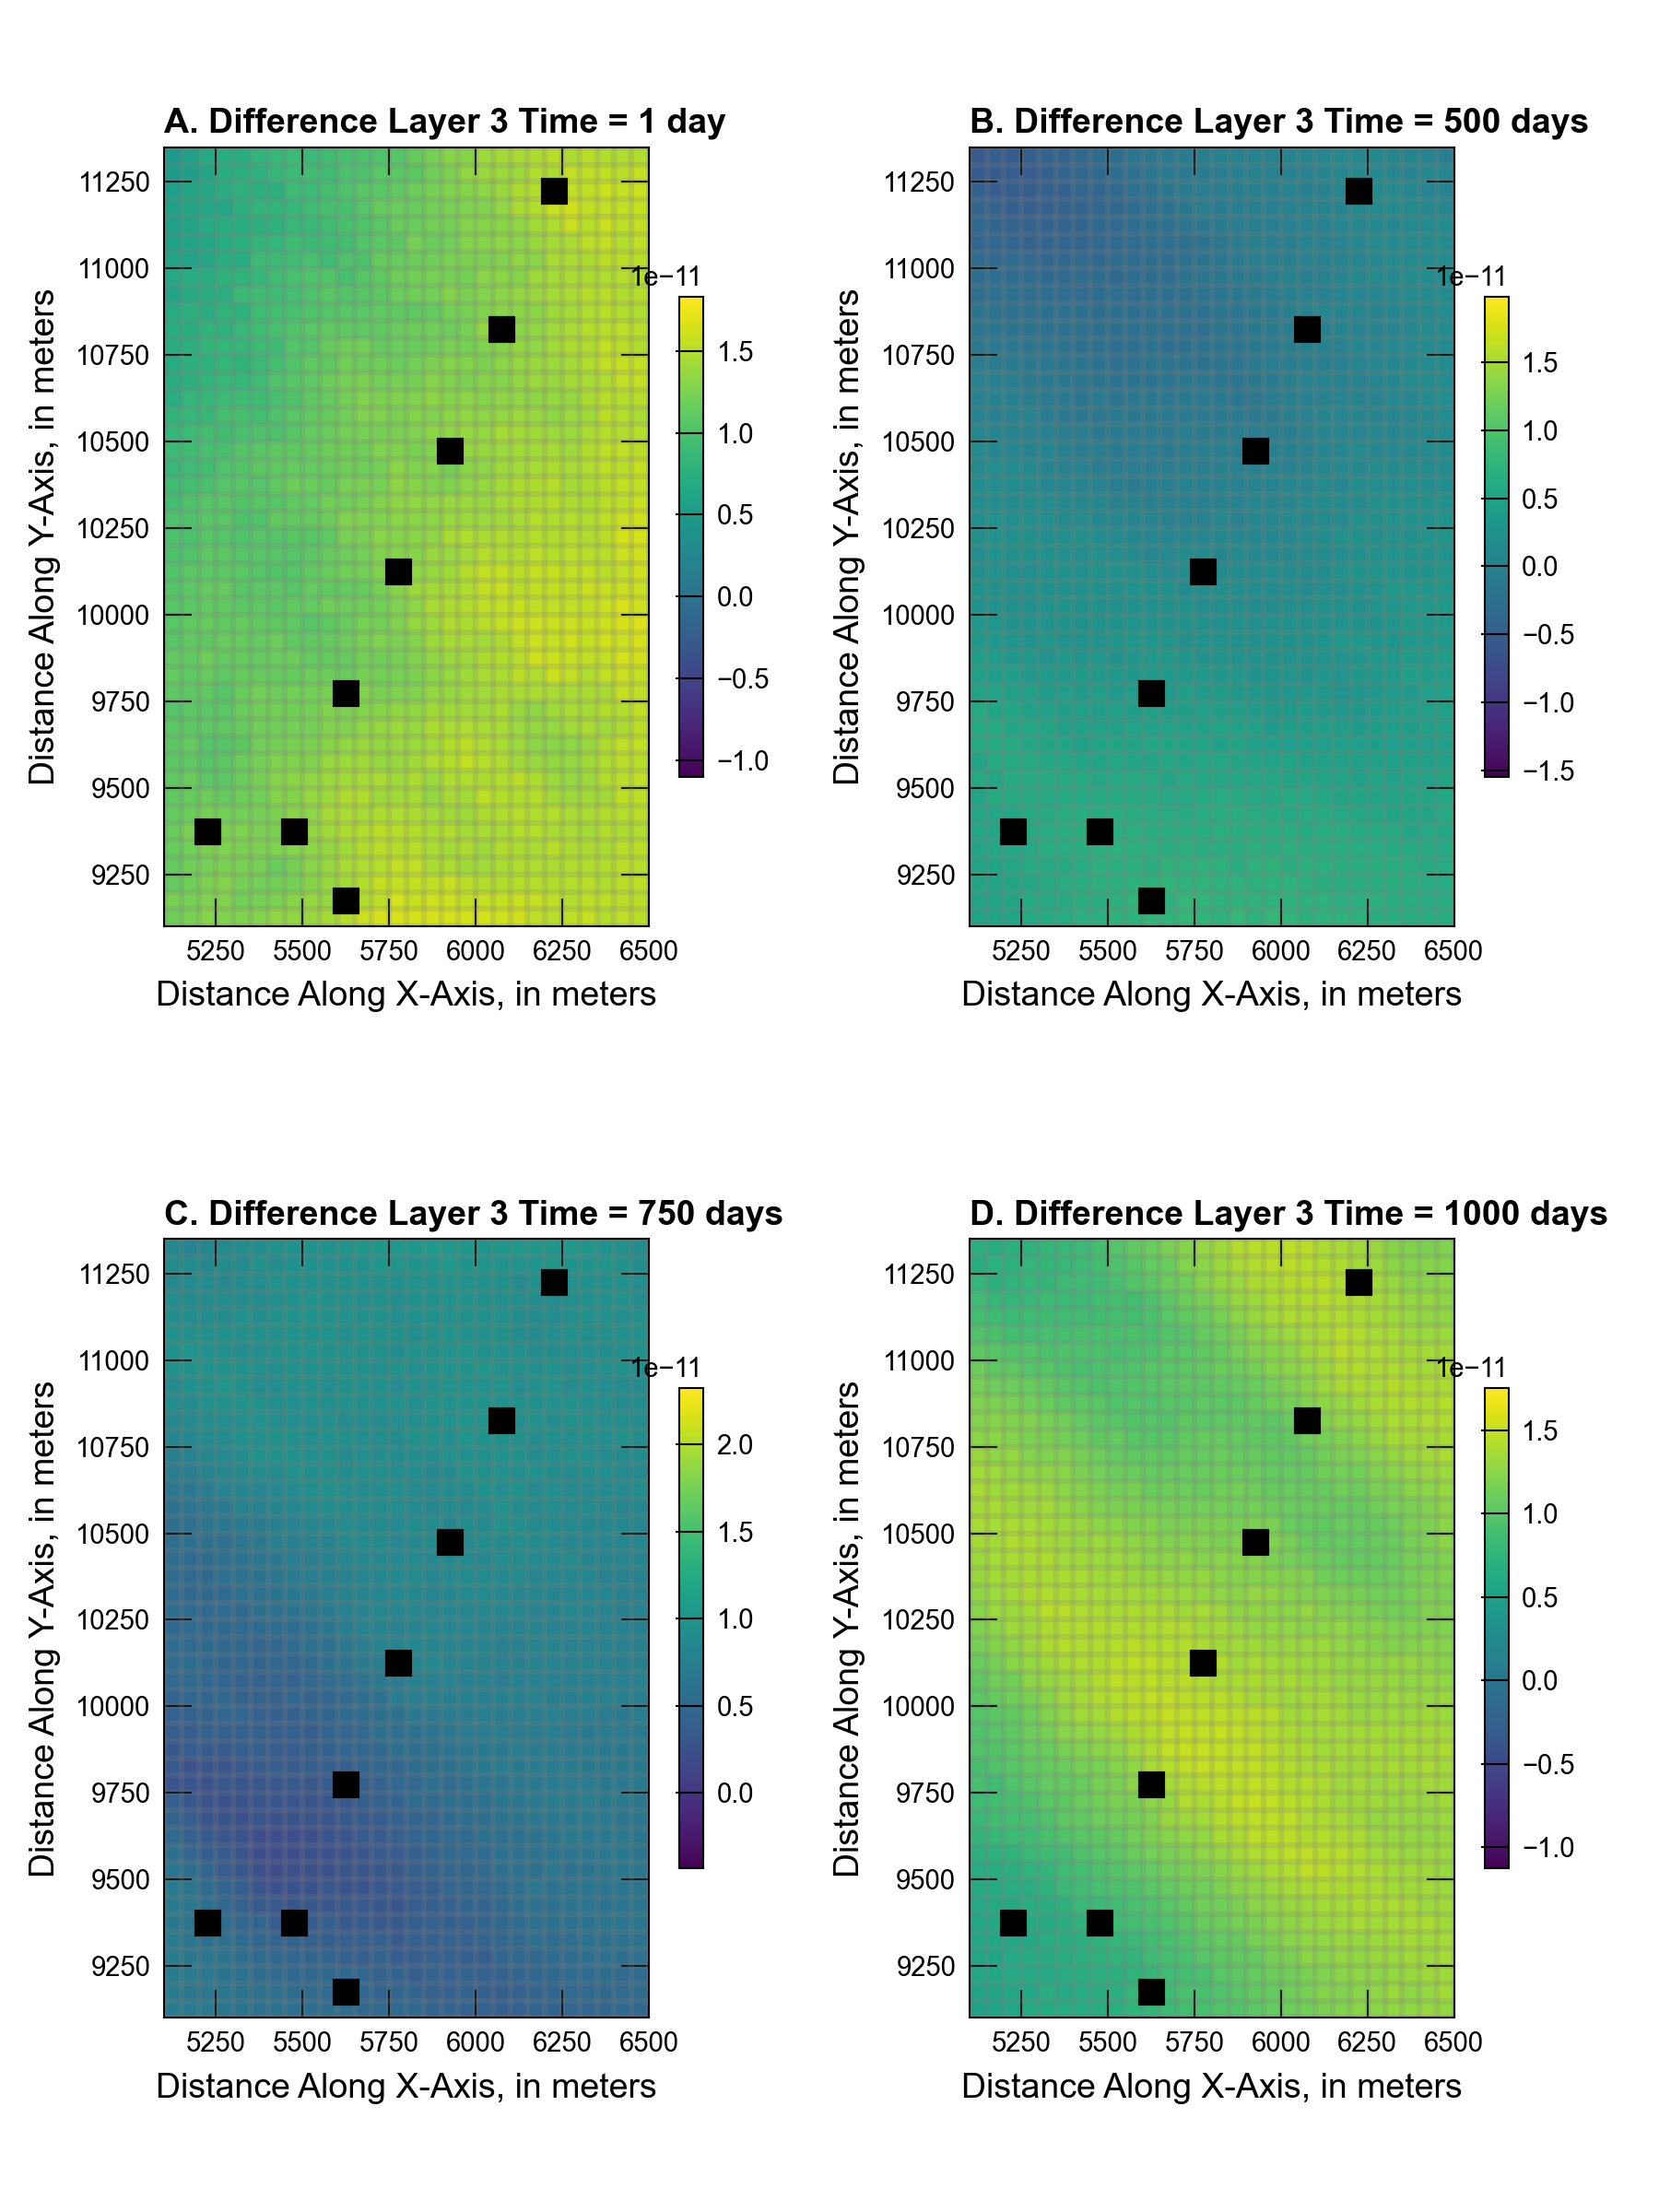
Figure 47.3 Difference in simulated head in model layer 3 with the multi-model setup with respect to the results from a setup containing a coupling between a single GWF and a single GWT model after (A) 1 day, (B) 500 days, (C) 750 days, and (D) 1,000 days.
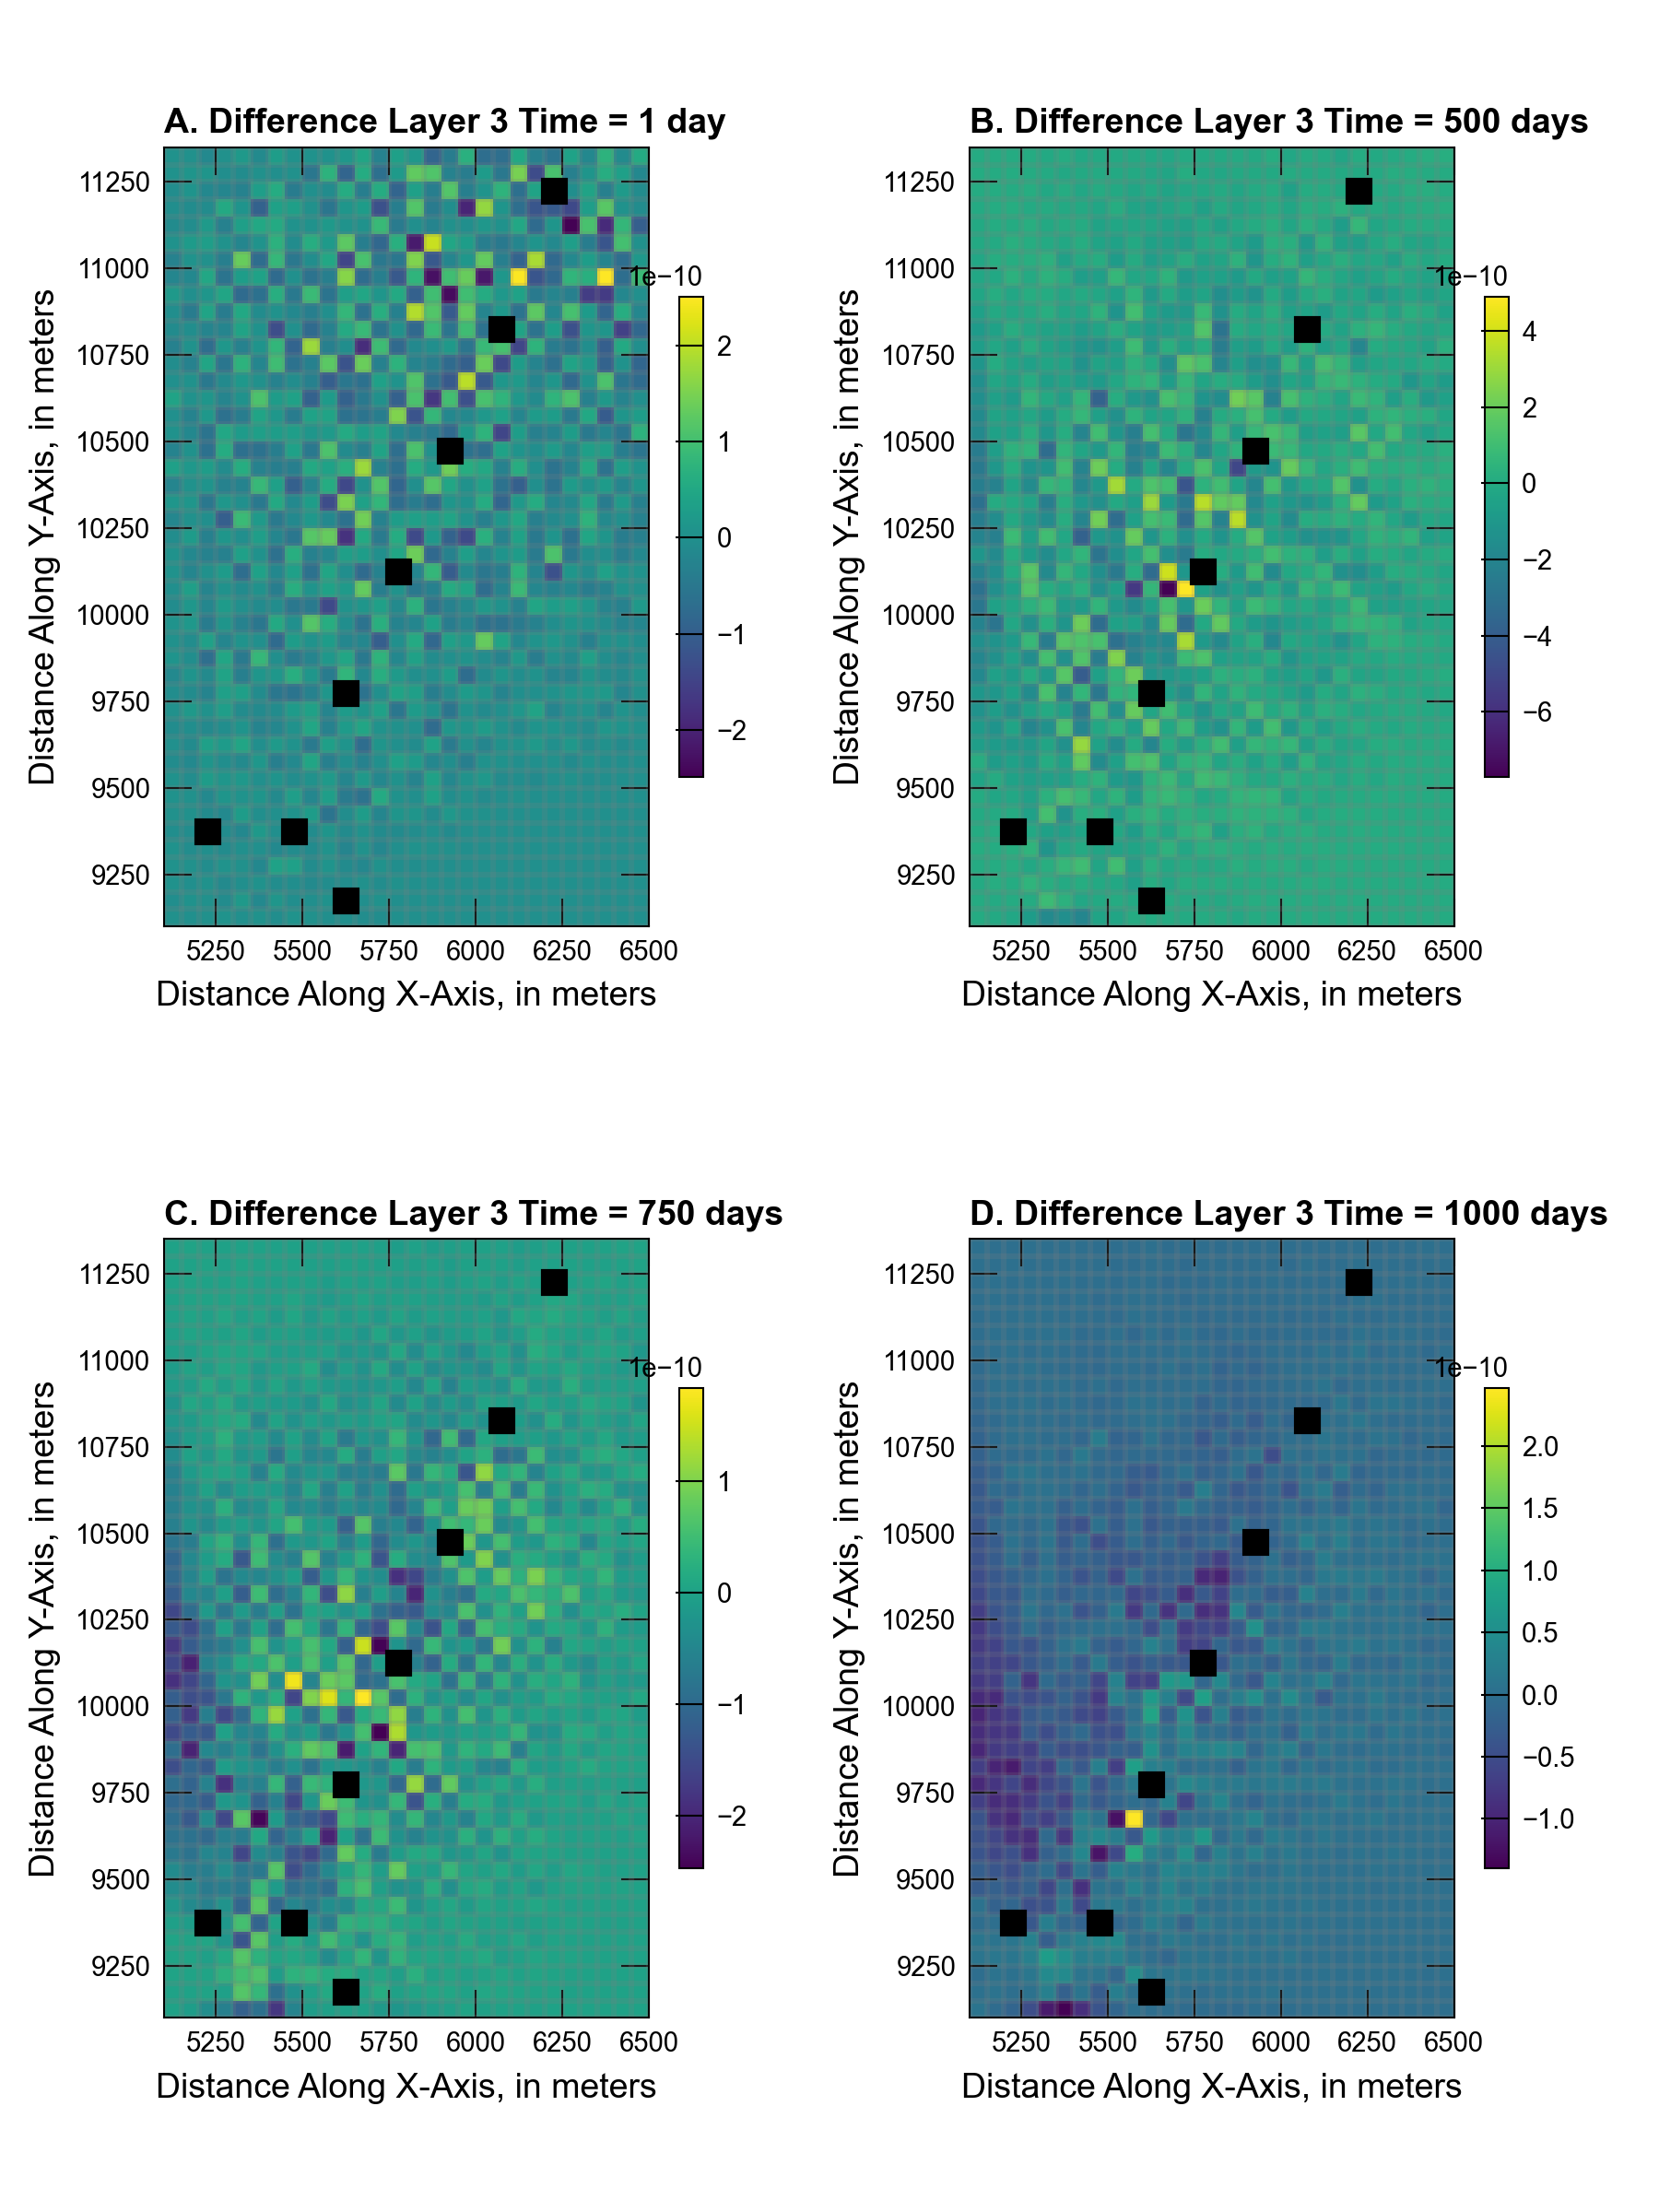
Figure 47.4 Difference in simulated concentrations in model layer 3 with the multi-model setup when compared to the results with a single GWF and single GWT model after (A) 1 day, (B) 500 days, (C) 750 days, and (D) 1,000 days.
47.3. References Cited
Zheng, C., & Wang, P. P. (1999). MT3DMS—a modular three-dimensional multi-species transport model for simulation of advection, dispersion and chemical reactions of contaminants in groundwater systems; documentation and user’s guide.
47.4. Jupyter Notebook
The Jupyter notebook used to create the MODFLOW 6 input files for this example and post-process the results is: