30. Drainage Discharge Scaling
This example is a modified version of the Unsaturated Zone Flow (UZF) Package problem 2 described in (Niswonger et al., 2006). UZF Package problem 2 is based on the Green Valley problem (Streamflow Routing (SFR) Package problem 1) described in (Prudic et al., 2004). The problem has been modified by converting all of the SFR reaches to use rectangular channels and to use the drain package drainage option to simulate groundwater discharge to the land surface.
30.1. Example Description
Model parameters for the example are summarized in Table 30.1. The model consists of a grid of 10 columns, 15 rows, and 1 layer. The model domain is 50,000 \(ft\) and 80,000 \(ft\) in the x- and y-directions, respectively. The discretization is 5,000 \(ft\) in the row and column direction for all cells. The top of the model ranges from about 1,000 to 1,100 \(ft\) and the bottom of the model ranges from about 500 to 1,000 \(ft\).
Twelve stress periods are simulated. The first stress period is steady state and the remaining stress periods are transient. The stress periods are \(2.628 \times 10^{6}\) seconds (30.42 days) in length. The first stress period is broken into one time step. Stress periods 2 through 12 are each broken up into 15 time steps and use a time step multiplier of 1.1.
Parameter |
Value |
|---|---|
Number of periods |
12 |
Number of layers |
1 |
Number of rows |
15 |
Number of columns |
10 |
Column width (\(ft\)) |
5000.0 |
Row width (\(ft\)) |
5000.0 |
Starting head (\(ft\)) |
1050.0 |
Hydraulic conductivity near the stream (\(ft/s\)) |
0.002 |
Hydraulic conductivity in the basin (\(ft/s\)) |
0.0004 |
Specific storage (\(1/s)\) |
1e-6 |
Specific yield near the stream (unitless) |
0.2 |
Specific yield in the basin (unitless) |
0.1 |
Vertical saturated hydraulic conductivity (\(ft/s\)) |
1e-6 |
Saturated water content (unitless) |
0.3 |
Initial water content (unitless) |
0.1 |
Base residual water content (unitless) |
0.1 |
Epsilon exponent (unitless) |
3.5 |
Evapotranspiration rate (\(ft/s\)) |
5.0e-8 |
Evapotranspiration extinction wilting content (unitless) |
0.10005 |
Evapotranspiration extinction depth (\(ft\)) |
15.0 |
Surface depression depth (\(ft\)) |
1.0 |
The basin fill thickens toward the center of the valley and hydraulic conductivity of the basin fill is highest in the region of the stream channels. Hydraulic conductivity is 173 \(ft/day\) (\(2 \times 10^{-4}\) \(ft/s\)) in the vicinity of the stream channels and 35 \(ft/day\) (\(4 \times 10^{-4}\) \(ft/s\)) elsewhere in the alluvial basin. A constant specific storage value of \(1 \times 10^{-6}\) (\(1/day\)) was specified throughout the alluvial basin. Specific yield is 0.2 (unitless) in the vicinity of the stream channels and 0.1 (unitless) elsewhere in the alluvial basin.
An initial head of 1,050 \(ft\) is specified in all model layers. Any initial head exceeding the bottom of each cell could be specified since the first stress period is steady-state.
The UZF Package was used to simulated delayed groundwater recharge through the unsaturated zone. A UZF boundary cell is simulated in every active model cell. Constant vertical hydraulic conductivity, saturated water content, initial water content, and Brooks-Corey epsilon exponent (Brooks & Corey, 1966) are specified for each UZF boundary cell (Table 30.2). The specified evapotranspiration extinction water content (Table 30.2 is multiplied by a factor of 1 in the valley lowland and 2 elsewhere.
Stress period |
Infiltration rate |
Pumping rate |
|---|---|---|
1 |
1.00e-9 |
-2.00 |
2 |
8.00e-9 |
-2.00 |
3 |
1.00e-8 |
-1.00 |
4 |
2.00e-8 |
-1.00 |
5 |
5.00e-9 |
-3.00 |
6 |
1.00e-8 |
0.00 |
7 |
3.00e-9 |
-2.00 |
8 |
5.00e-9 |
0.00 |
9 |
3.00e-9 |
-1.00 |
10 |
2.00e-9 |
0.00 |
11 |
1.00e-9 |
-3.00 |
12 |
1.00e-9 |
0.00 |
Infiltration from precipitation and evapotranspiration are represented using the UZF Package. Specified infiltration rates (Table 30.2) are multiplied by a factor ranging from 1 to 8; specified infiltration rates range from \(1.0 \times 10^{-9}\) to \(1.6 \times 10^{-7}\) \(ft/s\), with lower rates in the vicinity of the stream channels and higher rates elsewhere in the alluvial basin. Evapotranspiration is represented using the UZF package and occurs where depth to water is within 15 \(ft\) of land surface, has a maximum rate of \(5.0 \times 10^{-8}\) \(ft/s\) (1.6 \(ft/yr\)) at land surface, and is coincident with the valley lowland through which several streams flow.
Wells are located in ten cells (rows 6 through 10 and columns 4 and 5) along the west side of the valley. Withdrawal rates for each well ranged from 0 to -2 \(ft^{3}/s\) during the simulation (Table 30.2). Two general-head boundary cells were added in (row 13, column 1) and (row 14, column 8) with a specified head equal to 988 and 1,045 \(ft\), respectively, and a constant conductance of 0.038 \(ft^{2}/s\).
The streams in the model domain were represented using a total of 36 reaches. External inflows of 25, 10, and 100 \(ft^{3}/s\) were specified for reach 1, 16, and 28, respectively. Reach 1 is located in (row 1, column 1), reach 16 is in (row 5, column 10), and reach 28 is in (row 14, column 9). Streamflow discharges from the model at the downstream end of reach 36 in (row 13, column 1). Reach widths were specified to be 12, 0, 5, 12, 55, and 40 \(ft\) for reaches 1–9, 10–18, 19–22, 23–27, 28–30, and 31–36, respectively. The remaining streambed properties and stream dimensions used for each stream reach are the same as those used in (Prudic et al., 2004) (see Prudic et al., 2004Table 1). Constant stage reaches were used to define the ditch represented by reaches 10–15 and ranged from approximately 1,075.5–1061.6 \(ft\). A diversion from reach 4 to 10 was specified to represent managed inflows to the ditch. Ditch inflows were specified to be 10 \(ft^{3}/s\) except if the downstream flow in reach 4 is less than the specified diversion rate; in cases where the downstream flow in reach 4 is less than the specified diversion rate all of the downstream flow in reach 4 is diverted to the ditch and the inflow to reach.
Groundwater discharge to land surface was simulated with the drain (DRN) Package and the UZF Package groundwater seepage option. A surface depression depth of 1 \(ft\) was specified. When using the DRN Package to simulate groundwater discharge to land surface, the drain elevation is 0.5 \(ft\) below land surface, the drain conductance is 25 \(ft^{2}/d\), and the drainage depth is equal to the surface depression depth.
The mover (MVR) Package was used to route rejected infiltration and groundwater discharge to the land surface calculated by the UZF Package to the stream network. In the case where the DRN Package is used the MVR package routes the drainage discharge representing groundwater discharge to the land surface to the stream network. All of the rejected infiltration and groundwater discharge to the land surface are routed to the stream network using the FACTOR mover type with a value equal to 1.
The model uses the Newton-Raphson Formulation. The simple complexity Iterative Model Solver option and preconditioned bi-conjugate gradient stabilized linear accelerator is also used. Since the Newton-Raphson Formulation is used the simulation using the DRN Package to simulated groundwater discharge to the land surface cubic scaling is used to scale the drain conductance, consisting with groundwater seepage option in the UZF Package.
30.2. Example Results
Simulated infiltration to the unsaturated zone and groundwater seepage to the land surface results simulated using the DRN and UZF Packages are shown in Figure 30.1. Results using the DRN and UZF Packages are essentially identical (mean error = \(2.72 \times 10^{-8}\) \(ft^{3}/s\)) indicating the DRN package is capable of duplicating the groundwater seepage results for the UZF Package. Periods of high infiltration to the unsaturated zone correspond to increased in groundwater seepage to the land surface.
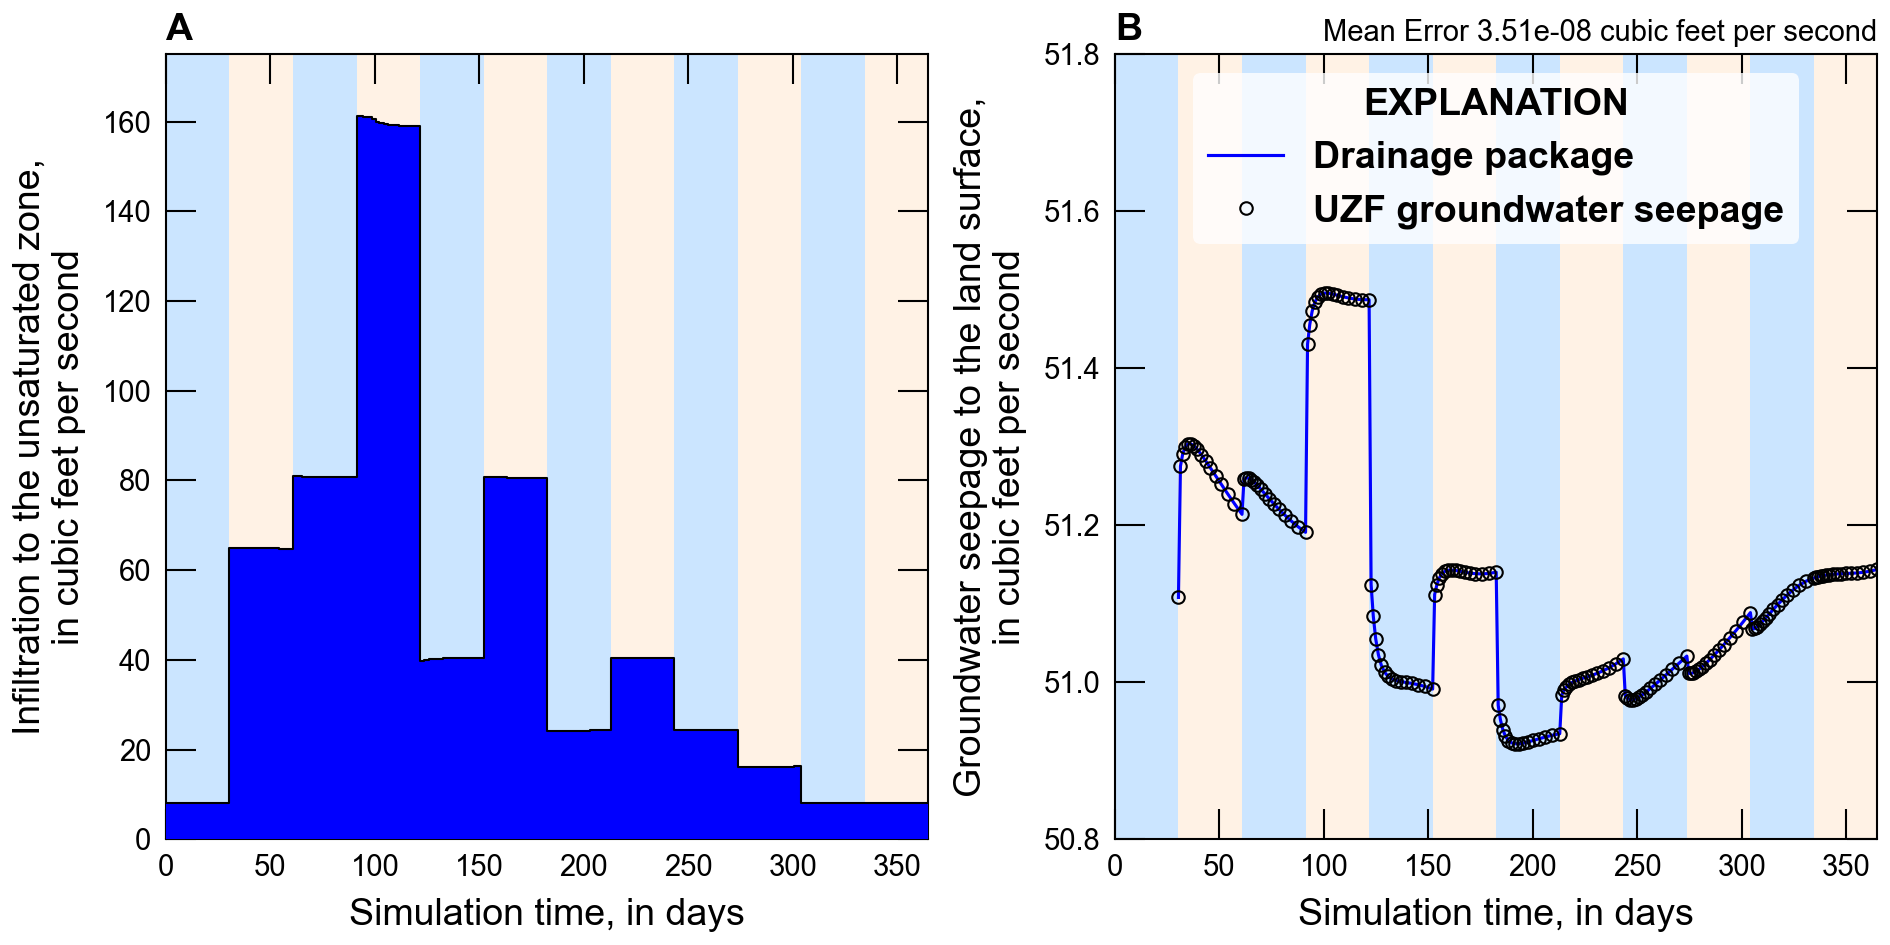
Figure 30.1 Simulated infiltration to the unsaturated zone and groundwater seepage to the land surface using the drain and unsaturated zone flow packages. The colored vertical bars delineate different stress periods. A. Infiltration to the unsaturated zone. B. Groundwater seepage to the land surface.
30.3. References Cited
Brooks, R. H., & Corey, A. T. (1966). Properties of porous media affecting fluid flow. American Society of Civil Engineers, Journal of Irrigation and Drainage, 92, 61–90. https://doi.org/10.1061/JRCEA4.0000425
Niswonger, R. G., Prudic, D. E., & Regan, R. S. (2006). Documentation of the Unsaturated-Zone Flow (UZF1) package for modeling unsaturated flow between the land surface and the water table with MODFLOW-2005. Retrieved from https://pubs.usgs.gov/tm/2006/tm6a19/
Prudic, D. E., Konikow, L. F., & Banta, E. R. (2004). A new streamflow-routing (SFR1) package to simulate stream-aquifer interaction with MODFLOW-2000. Retrieved from https://pubs.er.usgs.gov/publication/ofr20041042
30.4. Jupyter Notebook
The Jupyter notebook used to create the MODFLOW 6 input files for this example and post-process the results is: